
Energy Costs
Sanctions on Russia put in place in the weeks after its invasion of Ukraine effectively cut 11% of the world’s oil and 17% of its natural gas out of the market. This was particularly painful for Europe, which relied on Russian oil to power its cars and Russian gas to heat its homes. Governments across the continent spent most of the summer trying to accumulate stockpiles to last through the winter. This caused a spike in price from July onwards. Now winter has come, and it has been milder than expected. Stockpiles are lasting longer as a result, which has made purchasing gas less urgent and provided downward pressure on pricing. Even so, it is probably best to wait until the spring before making any purchases. Prices will continue to drop as the weather warms and the need for heating homes lessens.
The outlook for crude oil is somewhat different: we recommend waiting until the spring before buying diesel products but buying gasoline as needed. Early in December the European Union and G7 countries enacted a price cap of $60 on all oil products of Russian origin. The price cap means that Russian producers can no longer circumvent sanctions by exporting their goods to a third country and then selling them to the EU at market rate. It also means that Russian producers will make enough profit to keep exporting but not enough to prop up their economy. So far, it has been stunningly successful.
One barrel of oil or one BTU of natural gas is as useful as any other regardless of where it came from. This is what separates these goods from the other commodities we write about. Lumber and steel are costly to manufacture and transport, and consequently aren’t traded globally very much. Oil and gas are different, and what happens in the European or African markets affects pricing here in the United States. We would like to sound a note of caution, as the energy market is historically unstable and can change overnight.
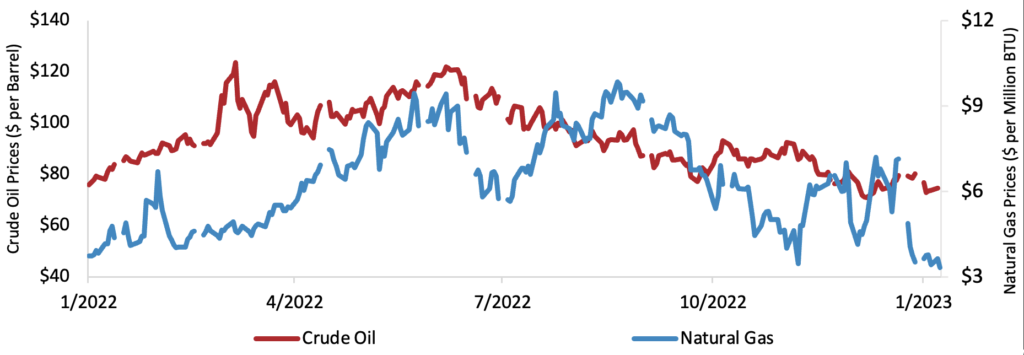
Source: Federal Reserve Bank of St. Louis
Copper Prices
Chile, Peru, and China – three countries that together produce almost 60% of the world’s copper – have each been beset by issues that affect their mining industries. Copper prices responded in November by rising for the first time in almost a year. Forecasters have been left to frantically rework their estimates, and because of this we recommend only making necessary purchases and awaiting further developments in the market.
Mass protests in Peru were triggered in December by the removal of the country’s 5th president since 2020. Protestors, particularly in the country’s rural (and copper-producing) provinces, have blocked highways and closed airports. This has kept mines from operating and sending their goods to the coast for export. In Chile, meanwhile, the recently elected president has made mining reform a cornerstone of his legislative agenda. This has serious consequences in a country where copper exports account for more than 30% of the government’s income. Mining companies across South America have become uneasy and prices have begun to tick up in response.
Somewhat fortunately, China’s struggles with COVID-19 have kept demand from rising too much. China is both one of the world’s largest consumers and producers of copper. In the past, government orders have hampered both mining output and things like construction or manufacturing. Now, these sectors are hampered by the virus sending workers to the hospital. This has kept demand from suddenly spiking as China’s zero COVID policy was lifted, as many experts feared.
There are still risks, but prices are staying roughly flat for now. Any policy change in Peru or Chile can cause prices to rise as mining companies scramble to adapt. New cases of COVID-19 in China are already trending down as the virus is running out of people to infect. This could cause things like construction to rebound, demand to surge, and copper prices to rise. Futures prices are trending up, indicating that investors expect this uneasiness to continue. The market is still forecasted to move into a surplus by the end of the year, so it is best to buy as needed until then. Markets can still change, however, and we continue to urge caution.
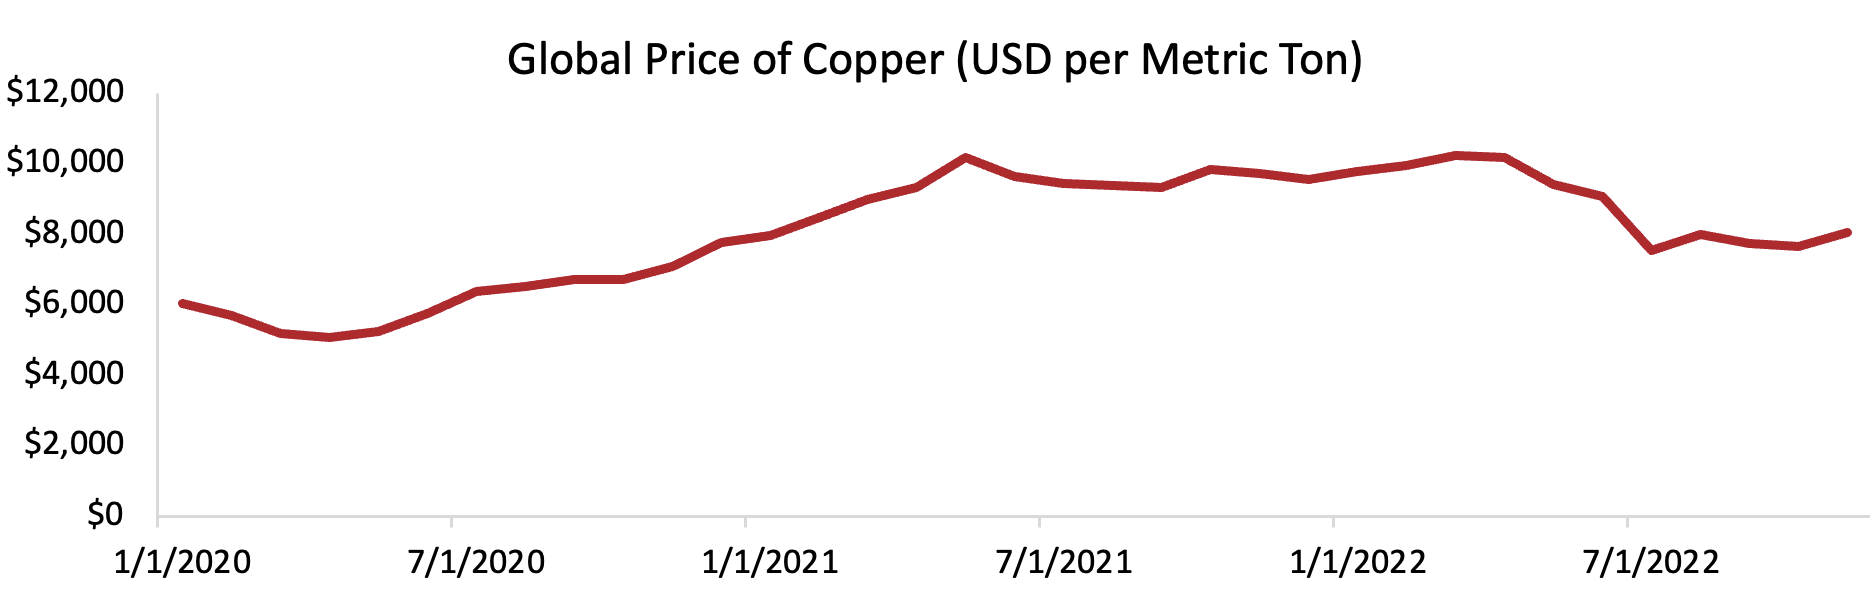
Source: Federal Reserve Bank of St. Louis, International Monetary Fund
Polyvinyl Chloride Prices
One of the many side effects of the Federal Reserve’s effort to bring inflation under control is downward pressure on polyvinyl chloride (PVC) prices. Forecasters predict that by the end of 2023, prices will be 25% lower than they were at the end of 2022. We, however, recommend only buying as needed for the next few months. There are significant risks that can send prices spiraling again, so it is best to keep these in mind when making purchases.
The largest portion of demand for PVC is in the construction industry, and the largest portion of demand for construction comes from the residential sector. The housing market is very sensitive to access to credit – when interest rates are high, borrowing becomes more expensive, and residential construction declines. This has made PVC more than 10% cheaper at the end of the year than at the beginning. In response to this decline in demand, plants have decreased their output. Whatever is not sold is added to inventory and stockpiles across the Gulf Coast are swelling. Two more plants are in the works and should be finished by 2025, further putting downward pressure on costs.
We advise only making purchases as necessary rather than waiting for prices to drop even more, as the market for PVC is on precarious footing. PVC is made using petrochemicals in a process known as “steam cracking,” which involves rapidly heating natural gas to induce a chemical reaction and then rapidly cooling the product. This is repeated several times to turn the output into a useful polymer, meaning that PVC production is uniquely vulnerable to changes in energy costs. PVC uses natural gas as both a key input and an important part of the manufacturing process. Any change in natural gas prices will be met with a similar change in PVC prices. Because of the war in Ukraine, a change in natural gas prices is quite likely.
The chart below shows historical trends for PVC in the construction industry, measured in percent change from the previous month. We continue to urge caution as forecasts and markets continue to change almost daily.
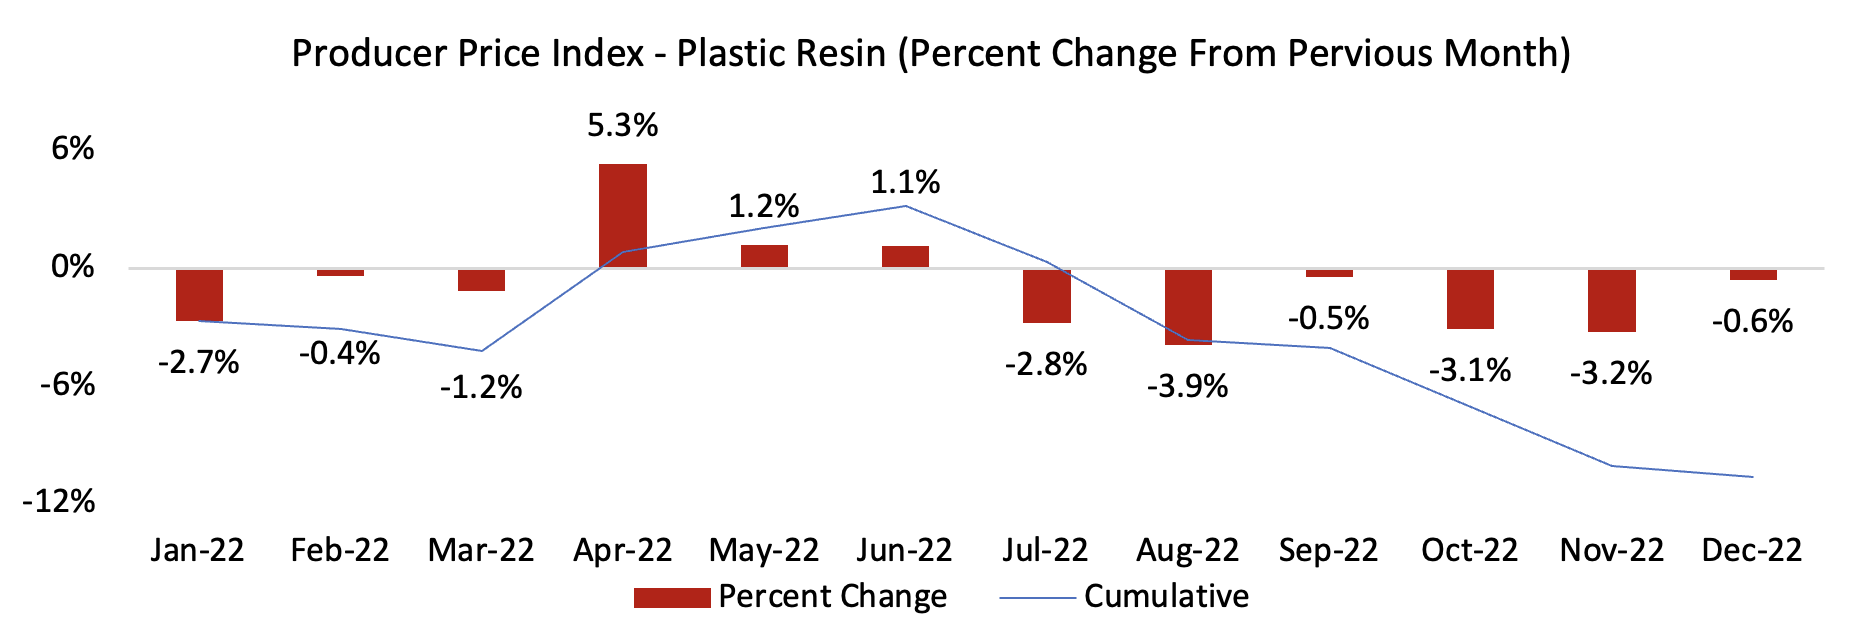
Source: Federal Reserve Bank of St. Louis