In today’s world, construction trends halfway across the world are playing a bigger role in our local construction costs than ever before – making these faraway trends something that deserves the attention of both college facility professionals and their construction management teams.
Each month, Cumming, an international cost consulting and project management firm with offices in Raleigh and across the Southeast, publishes an economic report that carefully looks at a number of indicators relevant to the local construction industry, such as general North Carolina building activity, changes in regional energy costs, availability of credit, and even global commodity trends. As a fully integrated project and cost management consulting firm for the construction industry, Cumming minimizes school district’s risk and helps to maximize the value of their projects through proactive and continuous management of cost and schedule.
Whether, it’s planning a major campus expansion or the modernization of a student health services building, this data from the monthly economic report is one of several tools used to help keep Cumming’s Construction Cost Database current. There are several key drivers of construction within the North Carolina market that will influence upcoming community college bond programs. Starting globally and finishing locally, these drivers include:
Global Demand – Due to the global nature of the construction material supply chain, North Carolina’s construction costs can be heavily influenced by international construction activity, material production and availability, and exchange rates. For example, China’s rate of growth has had a major influence on raw and processed building material pricing during the last 10 years. With the country using between 10- 30% of the world’s steel and cement supply, China continues to place significant price pressure on the rest of the world competing for resources, which trickles down into the everyday costs of our own projects here.
In terms of exchange rates, the value of the US Dollar saw a significant drop in Q4 of 2013, resulting in even higher costs for imported building materials – continuing to affect the local construction market and influence the scope of upcoming bond programs, due to cost fluctuations.
National Commodities and Materials Trends – The higher than expected US GDP in Q4 2013 (3.2%) has had an upward effect on domestic material pricing. Projected housing starts are also likely to keep material price pressure up, and to a smaller extent, the impacts from this past winter’s inclement weather in the Southeast.
Construction Lending Activity – Lending activity greatly impacts the volume of construction work on the street. At a national level, the Federal Office of the Comptroller issued a report that highlighted certain easing standards on bank lending for commercial projects. The report highlighted 86 of the largest national banks showing more of a risk appetite which, when combined with greater market liquidity, puts construction lending in a more positive light. Further good news for the local North Carolina market is that delinquent construction loans have dropped to less than 5.0% (compared to +16% at the bottom of the market in 2010). All of this positive news coming out about the industry will help to regain local buy-in when the topic of new district construction projects comes to that ever important community bond vote.
North Carolina Construction Volume – This indicator is by far the biggest driver of potential cost increase in the local market. Based on IHS Global Insight projections, overall 2014 construction volume (including residential and infrastructure) is projected to reach $33.4B in North Carolina, while the healthcare and public education sectors alone are expected to grow at a rate of 7%–8% over last year’s numbers.
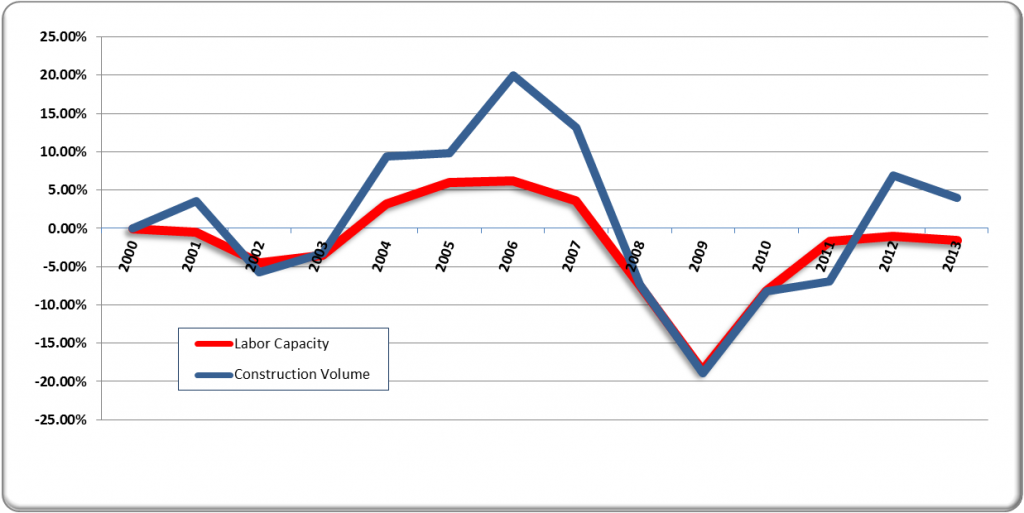
Local Trade Labor – Although trade availability is adequate for the current volume of work, any sudden spike in regional construction projects will likely result in higher bid day pricing and represent a significant market shift from the ultra-competitive “buyer’s market” of the last four to five years. To illustrate, in figure 1.1 below, we have identified the year over year movement of labor vs. volume.
As the North Carolina economy continues to improve – faster than the national average – we anticipate continued upward pressure on construction costs and, therefore, community college project budgets throughout the region. However, consulting with a program or project management team from the very beginning can help guide the project every step of the way by working to control cost, schedule and quality.
Figure 1.1 – North Carolina Construction Trade Labor vs. Construction Volume Year over Year